.gif?width=1920&name=Sample-Graphic-Animation%20(1).gif)


Reporting & Dashboards
Visualize, evaluate, and address the third-party risks impacting your organization.

VISUALIZATIONS
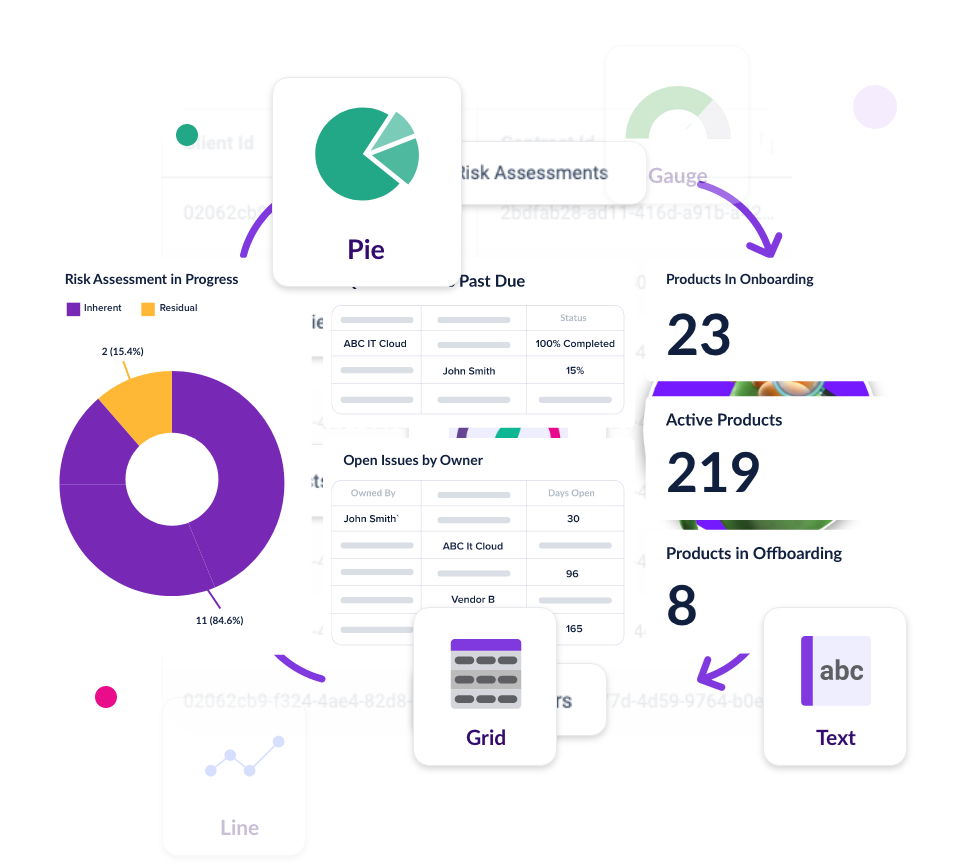
View data your way
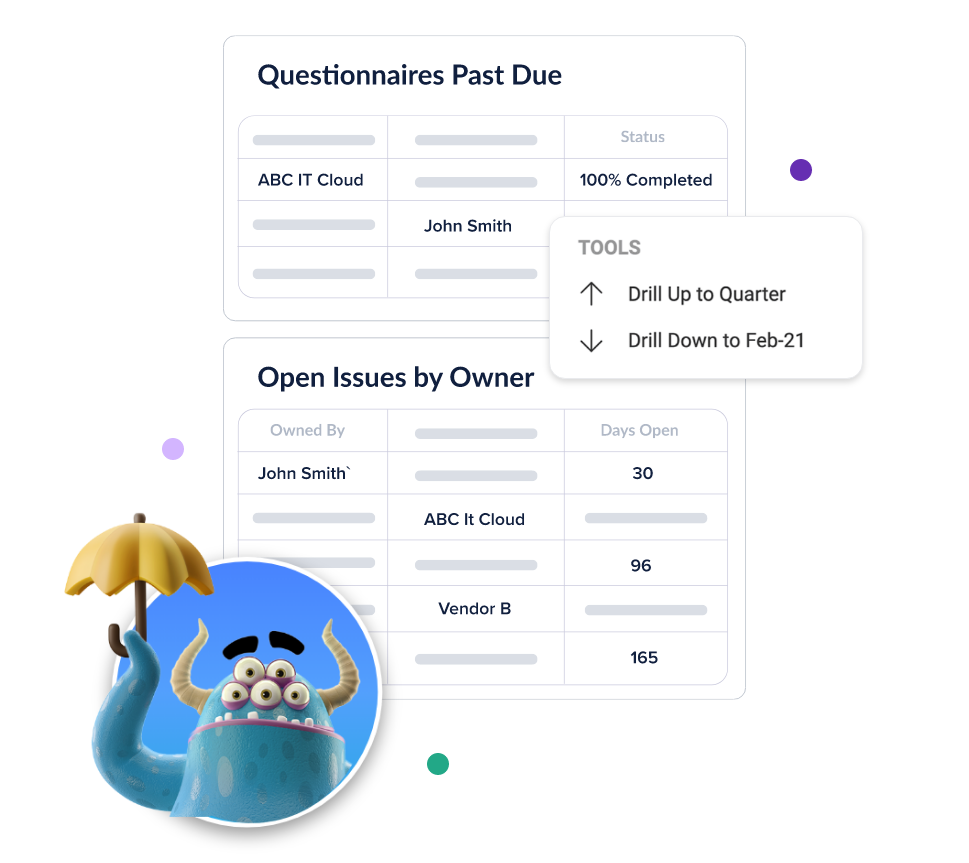
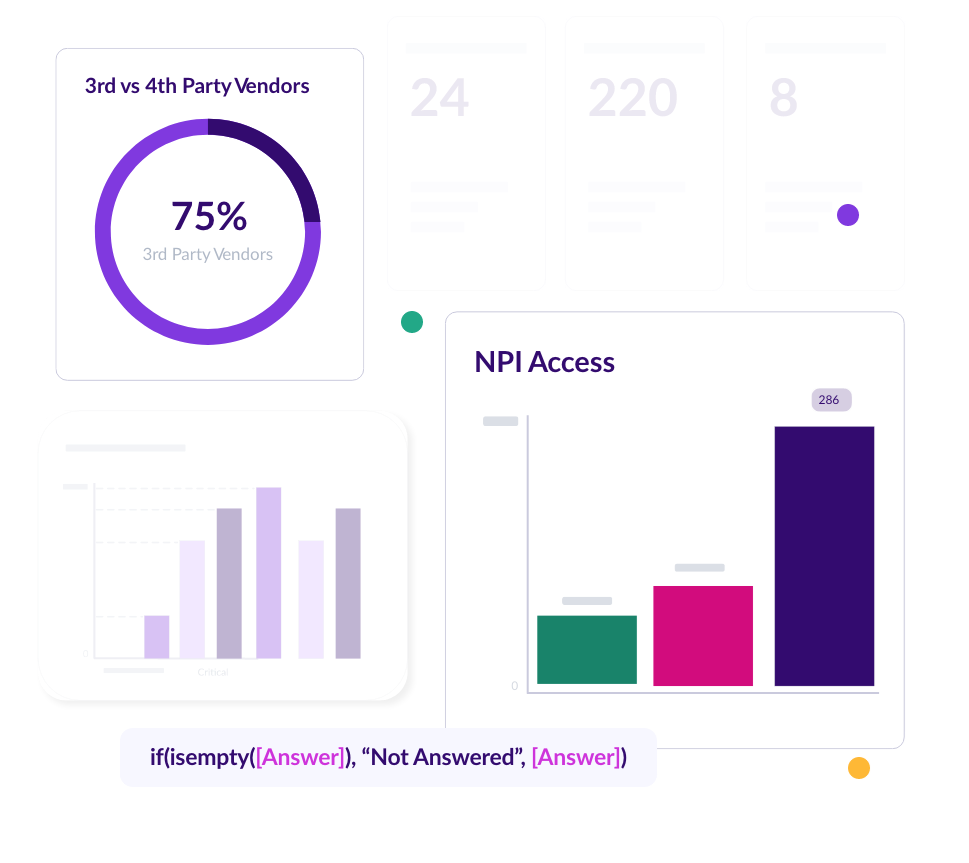
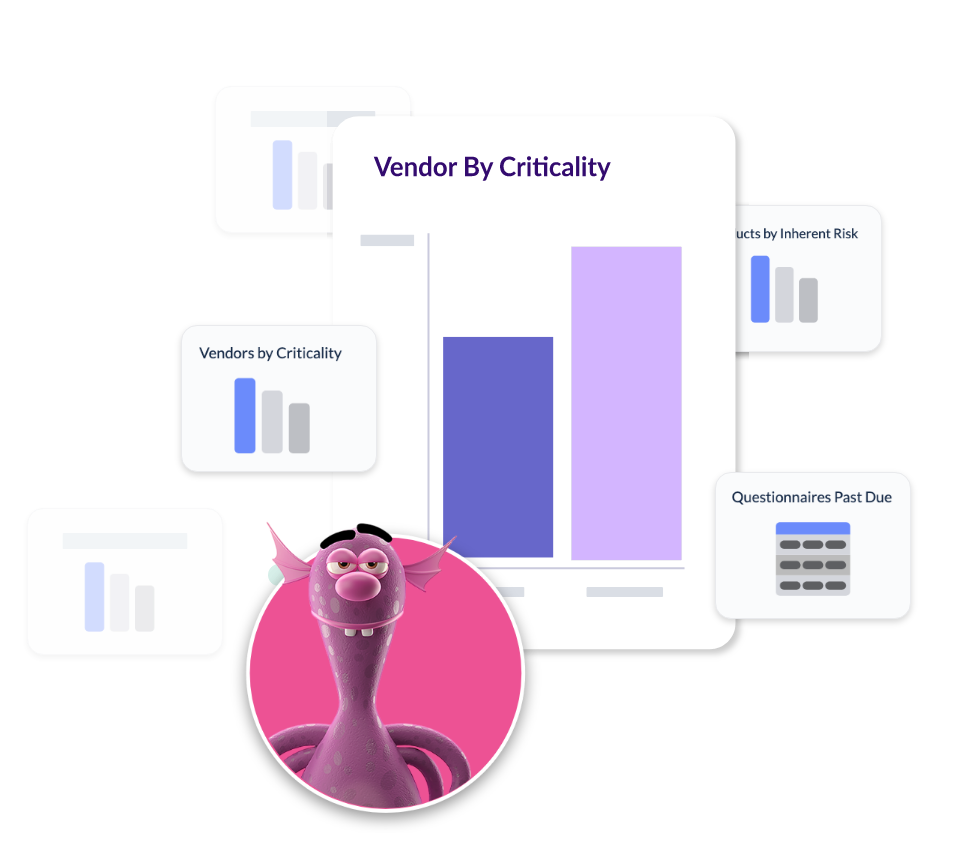
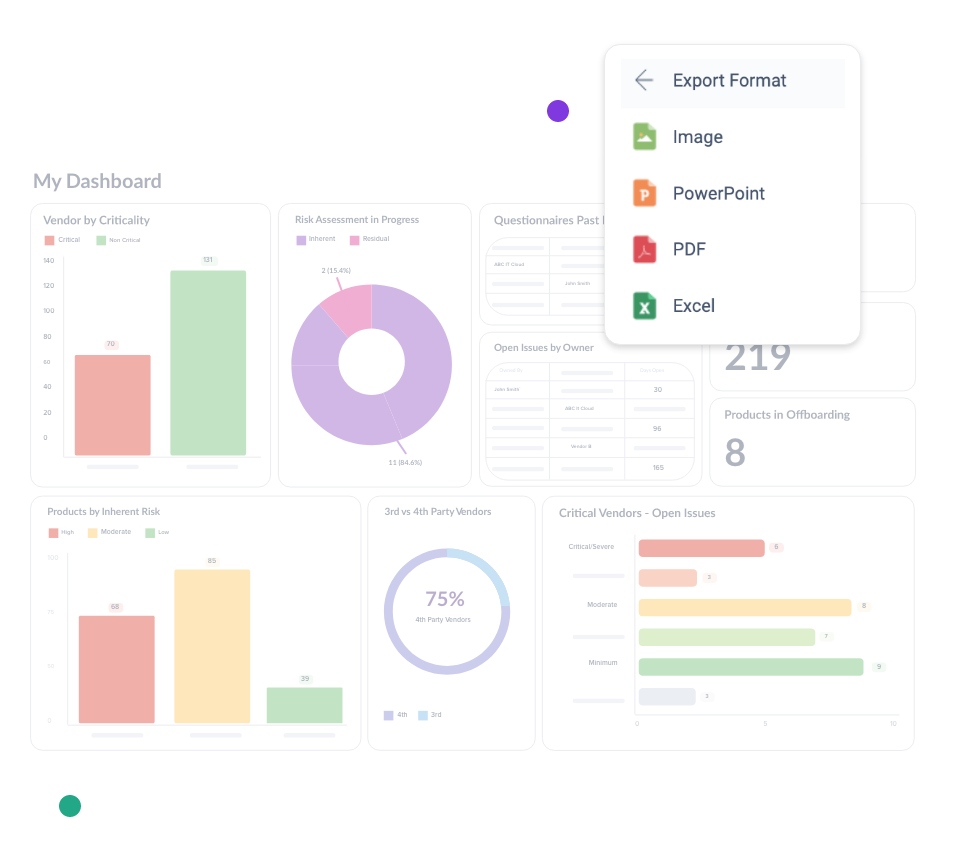
Build the reporting tools your organization needs with customizable no-code dashboards. Add visualizations such as bar charts, line graphs, and tabular views to further illustrate your data and stay up-to-date on status and results.
Drill-down capabilities enable risk managers to swiftly locate detailed information in areas of concern.


SEAMLESS CONNECTIVITY
The most updated data all the time
Venminder Dashboards integrate effortlessly with the Venminder platform, ensuring your risk assessments and monitoring are always up-to-date. With real-time data synchronization, you can maintain continuous oversight and respond swiftly to emerging threats. This seamless connectivity ensures a unified approach to managing third-party risks, aligning all data interactions smoothly within your operational ecosystem.
UNDERSTANDING THE DATA
Engage with data on a deeper level
Understand the data on a deeper level with interactive elements that allow you to drill down into specifics, adjust your views, and interact directly with the data points. This functionality is vital for uncovering hidden insights and understanding the intricacies of your vendor risk landscape.


It’s not just about our platform.
It’s about our people.
![]() Specialize in third-party risk management and are passionate about it's importance
Specialize in third-party risk management and are passionate about it's importance
![]() Hold a wide range of certifications and qualifications including CISSP, CTPRP, Paralegal, CPA, CRISC, GCIH, ABCP, CCNA, and more
Hold a wide range of certifications and qualifications including CISSP, CTPRP, Paralegal, CPA, CRISC, GCIH, ABCP, CCNA, and more
![]() Stay current on industry trends and latest news
Stay current on industry trends and latest news
![]() On hand to provide advice to our customers and community
On hand to provide advice to our customers and community
![]() Drive our educational content and advocate for best practice third-party risk management
Drive our educational content and advocate for best practice third-party risk management